
Standard Deviation, A Predictive Analytic Tool in CoSort
About Standard Deviation
Standard Deviation is a statistical measure of variance between data values and their mean (or average value). Standard deviation is calculated as the square root of that variance.
For that reason, the more spread apart the data, the higher the deviation. And the more observations that are input, the more accurate and valuable standard deviation output results are.
It’s common to see this measure used in the financial industry to gauge investment risk. For example, according to Investopedia,
“a volatile stock will have a high standard deviation while the deviation of a stable blue chip stock will be lower. A large dispersion tells us how much the return on the fund is deviating from the expected normal returns.”
Standard Deviation in CoSort
The rapid calculation of standard deviation is now a built-in aggregation function in the CoSort SortCL program. It can be used with these other SortCL aggregate transforms to output multi-level static, running, and sliding:
- totals
- averages
- maximums
- minimums
- counts
- multiplication results
- ranked values
- sequence numbers
Aggregating huge collections of data in the file system with CoSort is much faster, and more efficient than transforms in SQL, BI tools, or statistical applications — none of which are designed for big data integration, and otherwise require hardware upgrades or complex technologies like Hadoop to perform as well.
In addition, CoSort’s ability to maintain running aggregates of any length, and produce moving averages over any range, allow you to test predictive models and validate hypotheses about future market behavior based on historical data. By using standard deviation to measure volatility in this environment, you can make safer assumptions (based on normal distribution) to set expectations, and monitor and manage investment behavior accordingly.
CoSort and its SortCL program combine aggregations with other transformation, migration, protection, reformatting, and reporting functions. SortCL jobs use a simple, self-documenting 4GL for data definition and manipulation. The text scripts can also be created, modified, and deployed in a familiar Eclipse GUI with a syntax-aware editor, and seamless integration with BIRT for free, advanced data visualizations.
CoSort SortCL Job Sample [Tech Tip]
The example below is clipped for display purposes; one need only imagine intra- and inter-day trading data on multiple issues over many decades to conceive of possible input volumes. But here, given the first ten months of daily closing 2013 prices for the Dow Jones index in a file like this:
01/02/2013,13412.55
01/03/2013,13391.36
01/04/2013,13435.21
01/07/2013,13384.29
01/08/2013,13328.85
01/09/2013,13390.51
... [continuation]
09/19/2013,15636.55
09/20/2013,15451.09
09/23/2013,15401.38
09/24/2013,15334.59
09/25/2013,15273.26
09/26/2013,15328.30
09/27/2013,15258.24
09/30/2013,15129.67
10/01/2013,15191.70
… and this SortCL job script producing 20-day moving averages and their standard deviations,
/INFILE=djia.dat
  /FIELD=(date, POSITION = 1, SEPARATOR = ',')
  /FIELD=(closing, POSITION = 2, SEPARATOR = ',')
  /INCLUDE WHERE date > "07/01/2013"
/REPORT    # sorting not required
/OUTFILE=stdout     # piped records for console and BIRT display
  /FIELD=(date,  POSITION = 1, SEPARATOR = ',')
  /FIELD=(closing, POSITION = 2, SEPARATOR = ',')
  /FIELD=(twenty_mv_avg, POSITION = 3, SEPARATOR = ',')
  /FIELD=(s_t_d, POSITION = 4, SEPARATOR = ',')
  /FIELD=(upper = closing + std_dev, POSITION = 5, SEPARATOR = ',')  # upper
  /FIELD=(lower = closing - std_dev, POSITION = 6, SEPARATOR = ',')  # lower
  /AVERAGE twenty_mv_avg from closing running 20
  /STANDARD std_dev from twenty_mv_avg running 20
… the output contains these values:
07/02/2013,14932.41,15010,78,15010,14855
07/03/2013,14988.37,15011,83,15072,14905
07/05/2013,15135.84,15016,88,15223,15048
07/08/2013,15224.69,15015,90,15315,15135
07/09/2013,15300.34,15018,91,15391,15210
07/10/2013,15291.66,15026,89,15381,15202
... [continuation]
09/19/2013,15636.55,15120,132,15769,15504
09/20/2013,15451.09,15144,119,15570,15333
09/23/2013,15401.38,15164,105,15507,15296
09/24/2013,15334.59,15183,93,15428,15242
09/25/2013,15273.26,15208,83,15356,15190
09/26/2013,15328.30,15233,78,15406,15250
09/27/2013,15258.24,15254,78,15336,15180
09/30/2013,15129.67,15270,83,15213,15047
10/01/2013,15191.70,15288,91,15282,15101
where the standard deviation is shown between the twenty-day moving average and prices at the upper and lower ranges of the deviation for illustrative purposes.
When I ran this SortCL job from BIRT in the IRI Workbench GUI, I plotted the closing price in green so the blue shaded area above it (upper value) shows the moving standard deviation. Thus half the variances shown would yield values above or below the moving average for predictive purposes.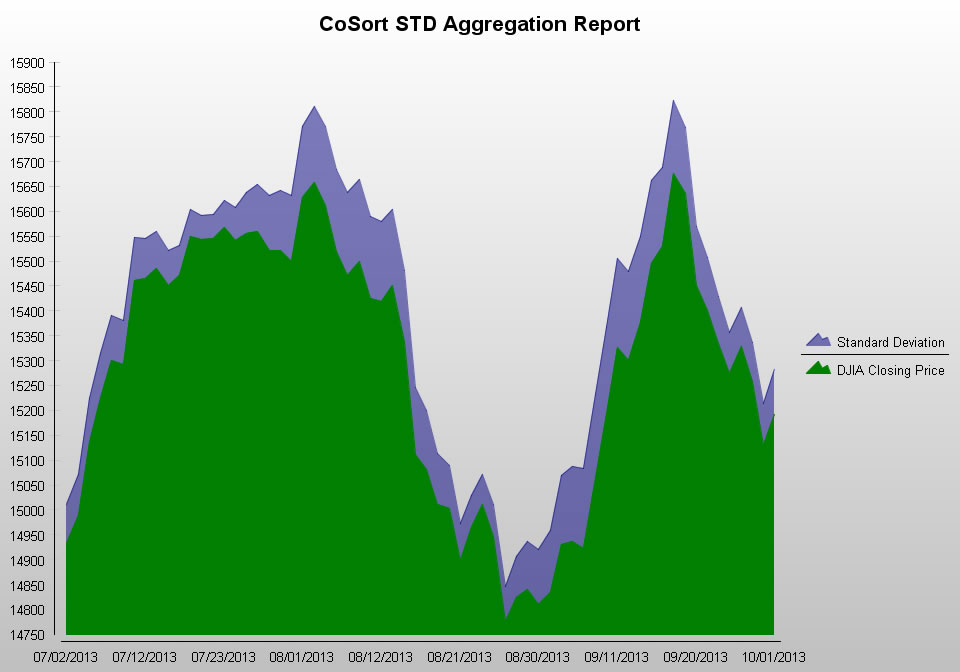 This BIRT chart — generated with real-time CoSort (SortCL) data preparation — shows the relative daily volatility of Dow Jones closing prices in the third quarter of 2013, via the standard deviation from its moving 20-day average.


2 COMMENTS
More examples?
And what about a standard deviation with conditions?
rgds
Sorry for a delayed reply to this inquiry, Mel. Yes, you can apply conditions as WHERE clauses in aggregation logic like this. Please email info@iri.com with your requirements if you’d like a job sample.