
Schema Migration: Relational to Star
Note: This article showcases the migration of a relational database (RDB) model to star schema using the Eclipse IDE for Voracity (and its included products), IRI Workbench, following an introduction to both architectures. If you are interested in migrating your RDB or data to a Data Vault 2.0 model, a new Workbench wizard will debut at the World Wide Data Vault Consortium in May 2019; subscribe to the IRI blog to get those step-by-step instructions as soon as they publish!
A data warehouse (DW) is a collection of data extracted from the operational or transactional system in a business, transformed to clean up inconsistencies, and then arranged to support rapid analysis and/or reporting. The DW requires a schema, or logical description and graphical representation of its operational database. This article touches on those topics while providing a how-to guide in moving from a conventional relational database schema into a popular DW schema called star schema.
Star Schema vs. Relational
Most relational data structures are illustrated in entity-relationship (ER) diagrams. An ER diagram is used in the development of conceptual models for an online transaction processing (OLTP) database management system. It is the source from which the table structure is translated.
The star schema, however, is the widely accepted standard for the underlying table structure of a data warehouse. Its simple star-shape (when ER-diagrammed) shows the fact table (containing transaction values or measures) in the center, and dimension tables (containing descriptive or attributive values) radiating from it. Usually, the fact table is in third-normal form (3NF), while dimensional tables are denormalized.
The basic differences between an entity-relational (ER) model and a star model are that:
- ER models use logical and physical structures for normalized database design
- Dimension models uses a physical structure for denormalized database design
To see how IRI software can de/normalize data through row-column pivoting, click here.
Conversion Process Background
In this article, I demonstrate how to convert data from a relational model into star using jobs you should define more or less manually, but can create and run automatically, and modify easily.
What you will see here are IRI’s 4GL data and job specifications — expressed in “SortCL” scripts[1] — that map data into dimension tables, and join data into the central fact table. SortCL is the core data manipulation and mapping program in the IRI Voracity data management and ETL platform. However, understanding the methodology and mappings in my SortCL jobs is the key here, not the scripting syntax.
The free Eclipse GUI, IRI Workbench, provides a syntax-aware SortCL editor, as well as graphical outlines and dialogs, workflow and mapping diagrams, and intuitive job wizards, to automatically build or modify these scripts if you don’t want to do it by hand. FYI, IRI uses the same metadata and GUI for profiling and diagramming DBs, generating test data, performing ETL, formatting reports, masking PII, capturing changed data, migrating and replicating data, cleansing and validating data, etc.
Workbench uses an enhanced version of the Data Tools Platform (DTP) plug-in for Eclipse to connect to databases over JDBC, and to enable SQL operations and IRI metadata exchange in the Data Source Explorer (DSE) view. In this case, the Workbench is supporting:
- the creation and population of constrained Oracle test (source) tables via SortCL (or IRI RowGen jobs, per this article)
- the mapping of entity table data into Dimension tables via SortCL
- the mapping of fact elements as an n-ary relation to associate the principle dimension table; i.e. performing a multi-table join in SortCL to create the Fact table
- population of all target (star schema) tables
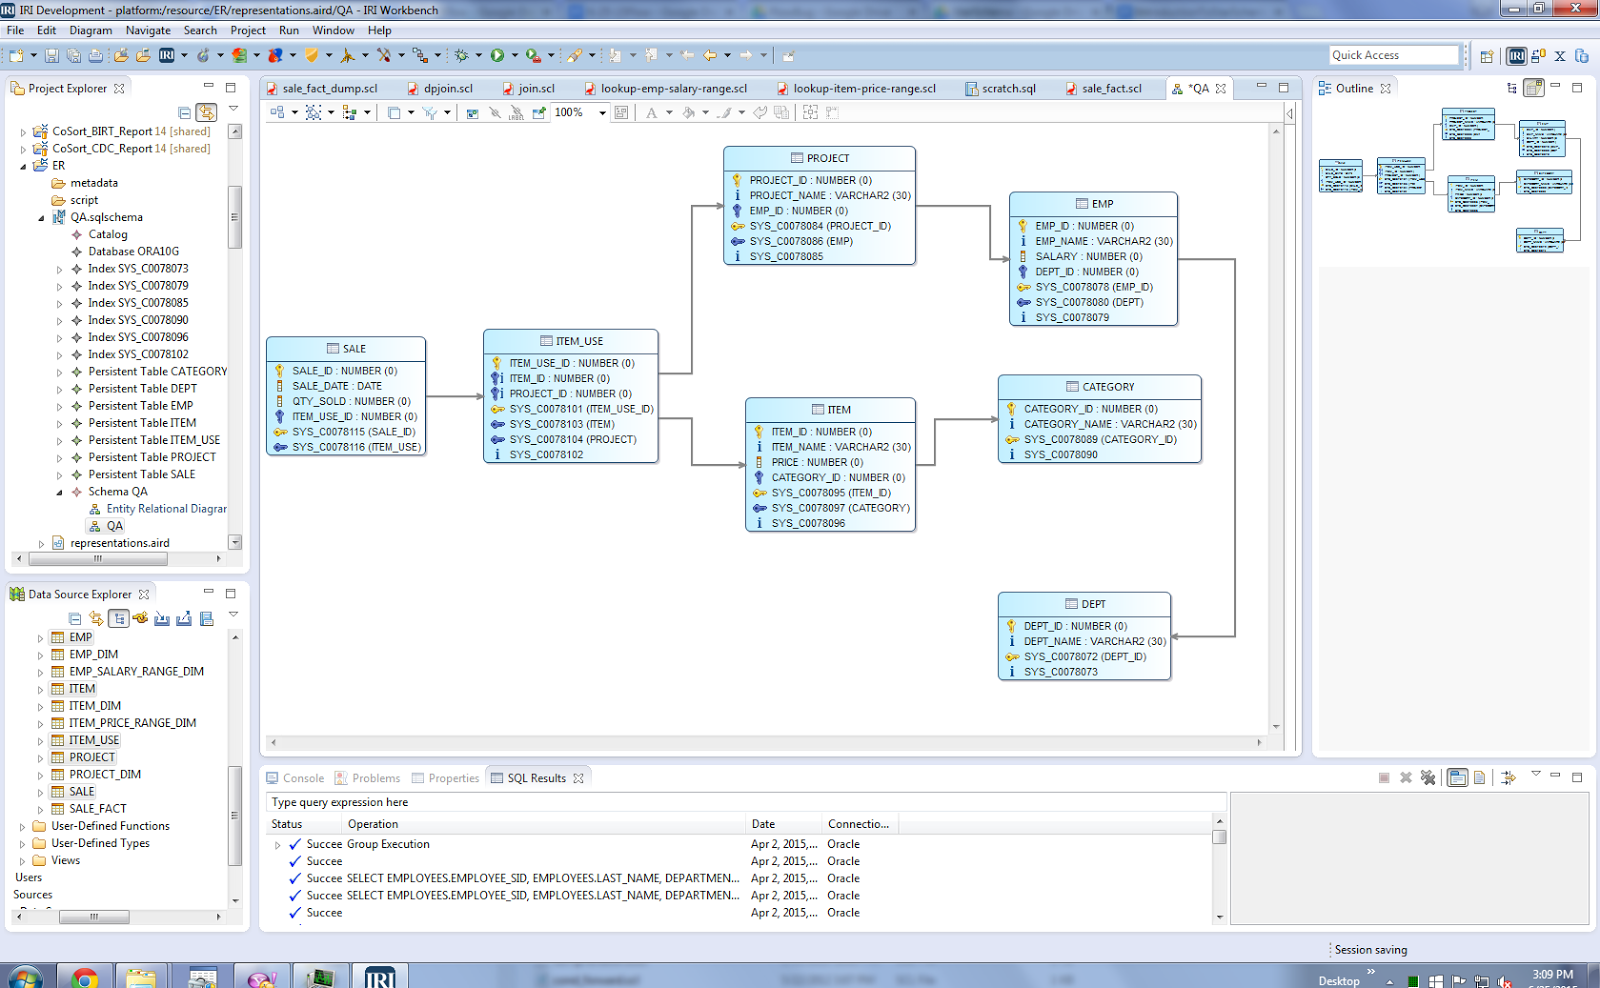
- ER diagrams[2] of the source and target schemas[3]
The entity types in my original relational model are: Dept, Emp, Project, Category, Item, Item_Use, and Sale:
Before …
The next diagram shows the final Star model with eight dimension tables and one fact table. The dimension tables are: Dept_Dim, Emp_Dim, Emp_Salary_Range_Dim, Project_Dim, Category_Dim, Item_Price_Range_Dim, Item_Dim. The fact table in the center is Sale_Fact, which contains keys to all the dimension tables.
… After

Conversion Steps
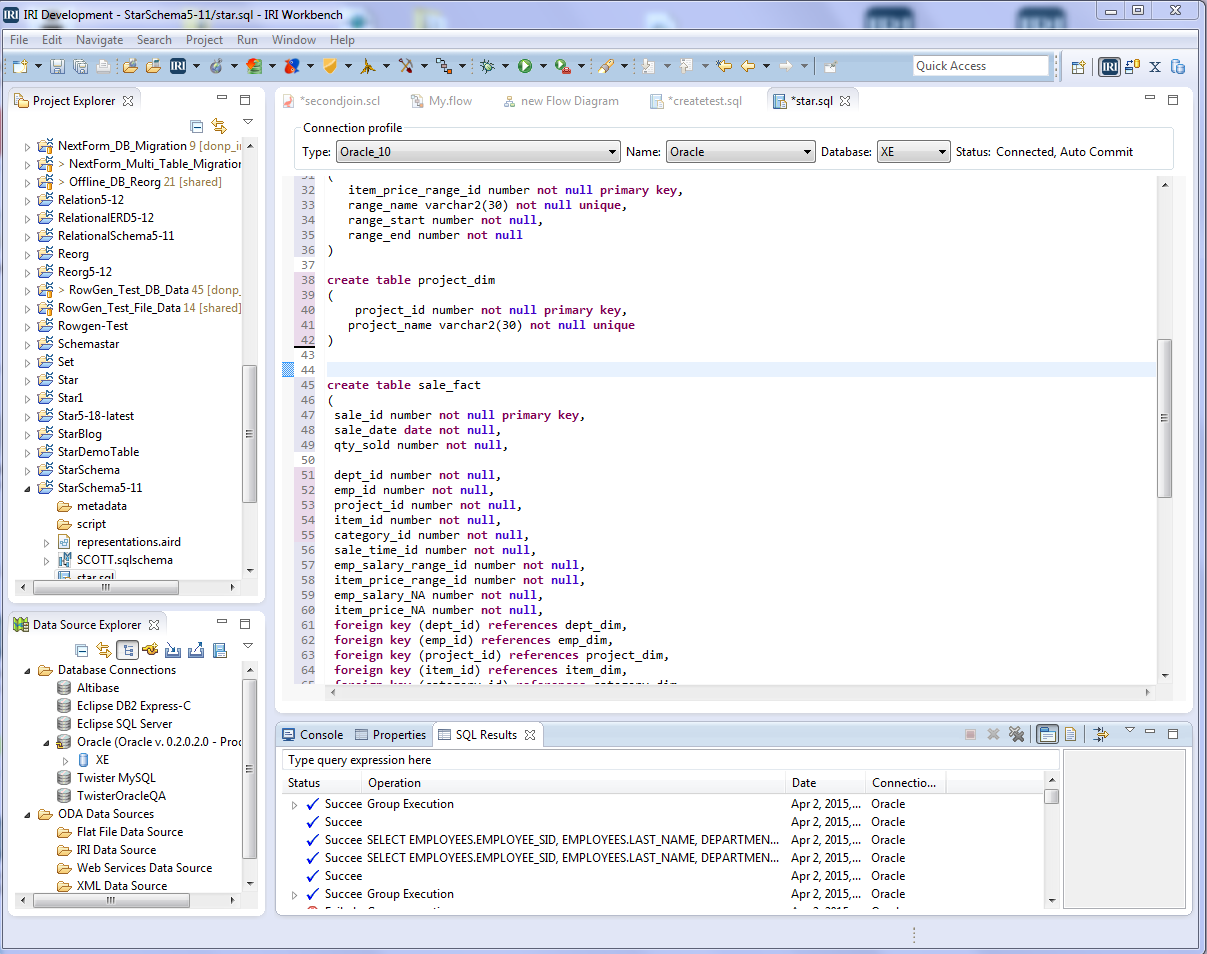
- Define and create the Fact table
The structure for Sale_Fact table is shown in this document. The primary key is sale_id, and the rest of the attributes are foreign keys inherited from the Dimension tables.I am using an Oracle database (though any RDB works) connected to the Workbench DSE (via JDBC) and SortCL for data transformation and mapping (via ODBC).[4] I created my tables in SQL scripts edited in DSE’s SQL scrapbook and executed in the Workbench.
- Define and create the Dimension tables
Use the same technique and metadata linked above to create these Dimension tables that will receive the relational data mapped from SortCL jobs in the next step: Category_Dim table, Dept to Dept_Dim, Project to Project_Dim, Item to Item_Dim, and Emp to Emp_Dim. You can run that .SQL program with all the CREATE logic at once to build the tables.
- Move the original Entity table data into the Dimension tables
Define and run the SortCL jobs shown here to map the (RowGen-created test) data from the relational schema into Dimension tables for the Star schema. Specifically, these scripts load data from the Category table to the Category_Dim table, Dept to Dept_Dim, Project to Project_Dim, Item to Item_Dim, and Emp to Emp_Dim.
- Populate the Fact Table
Use SortCL to join data from original Sale, Emp, Project, Item_Use, Item, Category entity tables to prepare data for the new Sale_Fact table. Use the second (join job) script here.
To enhance our example, we’ll also use SortCL to introduce new dimensional data into the Star schema upon which my Fact table will also rely. You can see these additional tables in the Star diagram above that were not in my relational schema: Emp_Salary_Range_Dim and Item_Price_Range_Dim. Those tables are created in the same .SQL file for the Fact and other Dimension tables.
The Fact table needs the emp_salary_range_id and item_price_range_id data from these tables to represent the range of values in those Dimension tables. When I load the dimensional price values into the data warehouse, for example, I want to assign them to a price range:
| Item_Price | Range_Id | Range_Name | Range_End |
|---|---|---|---|
| 1 | Low | 1 | 100 |
| 2 | Mid | 101 | 500 |
| 3 | High | 501 | 999 |
The simplest way to assign range IDs in the job script (that is preparing data for my Sale_Fact table) is to use an IF-THEN-ELSE statement in the output section. See this article on bucketing values for background.
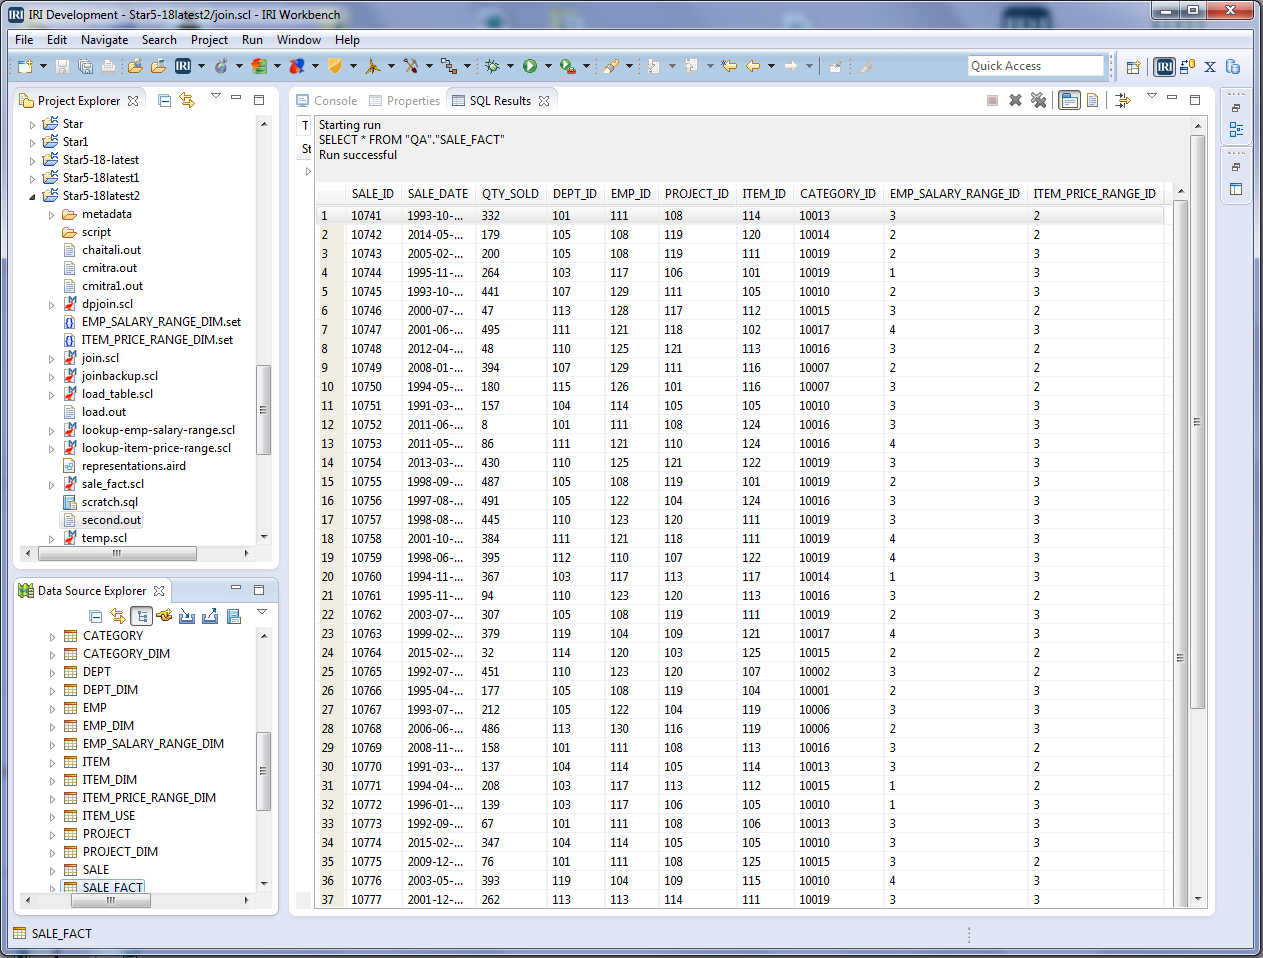
Anyway, I created this entire job with the CoSort New Join Job wizard in the Workbench. And once I ran it, my fact table was populated:
Sale_Fact table display in the IRI Workbench DSE
Conclusion
The major advantage of dimensional data representation is reducing the complexity of a database structure. This makes the database easier for people to understand and write queries against by minimizing the number of tables, and therefore, the number of joins required. As mentioned earlier, dimensional models also optimize query performance. However, it has weakness as well as strength. The fixed structure of the Star Schema limits the queries. So, as it makes the most common queries easy to write, it also restricts the way the data can be analyzed.
The IRI Workbench GUI for Voracity has a powerful and comprehensive set of tools that simplify data integration, including the creation, maintenance, and expansion of data warehouses. With this intuitive, easy-to-use interface, Voracity facilitates fast, flexible, end-to-end ETL (extract, transform, load) process creation involving data structures across disparate platforms.
In ETL operations, data are extracted from different sources, transformed separately, and loaded into a Data warehouse and possibly other targets. Building the ETL process is, potentially, one of the biggest tasks of building a warehouse; it is complex and time consuming. IRI’s ETL approach supports this process in a highly efficient, and database-independent way, by performing all of the data integration and staging in the file system.
[1] If you are a syntax hound, note that SortCL scripts used in the IRI CoSort product or IRI Voracity platform support the same syntax and data definitions as IRI RowGen for test data generation, IRI NextForm for data migration, and IRI FieldShield for data masking. All those tools are all supported in the IRI Workbench GUI, and their metadata can also be shared and team managed for version control, job/data lineage, and security in the cloud.
[2] To display E-R diagrams in IRI Workbench:
- Select New IRI Project and create a New Folder
- Select that folder and highlight all the applicable database tables in the Data Source Explorer; then right click IRI, New ER-Diagram
- A File (Schema.QA) will be created
- Right click on that File, and select New Representation, New Entity Relation Diagram.
[3] The elements of ER diagram that illustrate such models include the:
- defined entity types
- defined attributes
- the relationship between the entity types
- overall picture, or conceptual diagram
[4] IRI FACT and SQL*Loader are bulk extraction and loading options, respectively.


1 COMMENT
Star is the simplest form of data mart schema used most widely to develop data warehouses and dimensional data marts. Thus migration from relational to star schema is a good choice.