
Shedding Light on Dark Data with Splunk ES
Splunk Enterprise Security (ES) is a major player in the Security Information and Event Management (SIEM) software market. The cloud-based analytic platform combines the indexing and aggregation capabilities of Splunk Enterprise with a range of fit-for-purpose features attendant to SIEM environments.
Splunk ES collects and aggregates log data generated throughout the organization’s technology infrastructure, from host systems and applications to network and security devices such as firewalls and antivirus filters. Splunk can thus be used to efficiently and graphically identify, categorize, and analyze security incidents from device and event log data provided to it.
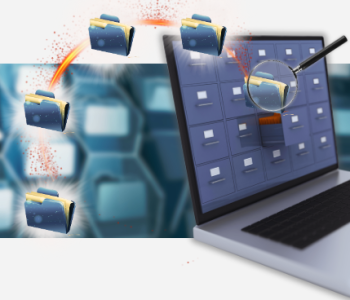
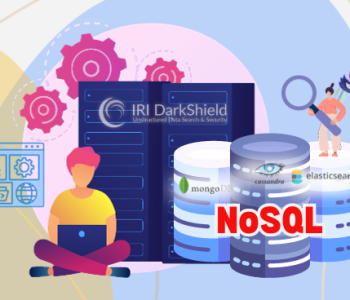
IRI DarkShield is a machine-learning-enabled data discovery and masking package for personally identifiable information (PII) in dark data (unstructured) files — like email repositories, .pdf and Microsoft documents, and images. DarkShield produces a high volume and quality of log file results from its PII search and mask operations.
These flat-file extracts from DarkShield can feed Splunk ES to produce insight into PII-related vulnerabilities in various files on the network, and those that DarkShield already protected. Other IRI software, including FieldShield and CellShield EE, produce similar logs.
In the case of DarkShield, the results of its LAN-wide file searches and masking operations are saved into PSV (pipe separated values) or other delimited files.The sample log used in this article contains the fields:
Name|Result|Span|Owner|Regularity|Linkage|Read Only|Hidden|File Size|Date Created|Date Modified|Date Accessed|File Path|File Type
Adding DarkShield Data Source
Splunk ES can be accessed via “My Instances” in your Splunk profile. Once you locate the DarkShield PSV file, upload it via the “Add Data” option in the Splunk ES Settings menu:
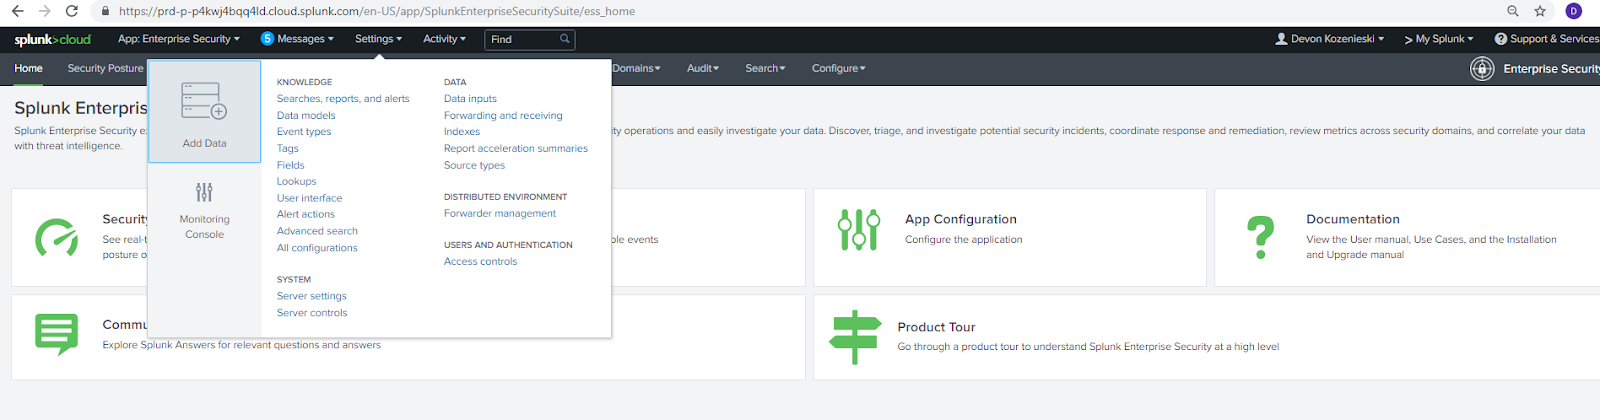
Be sure to specify the delimiter properly, be it a pipe, comma, etc. Set the time field to your liking, as that value is used for some visualizations. To do that, select the Timestamp drop down menu and set the time field to use for timestamps in Splunk ES based on what the time field is in the logs. Select “Advanced” extraction, then enter the name of the field to use as the timestamp.
Proceed through the next few menus following “Set Source Type” by using the default settings. Finally, the file should be uploaded and ready for searches in Splunk ES.
Accessing DarkShield Data
Now that your DarkShield log data has been indexed, it is now accessible to the Splunk search feature, which is also used to generate visualizations of the data.
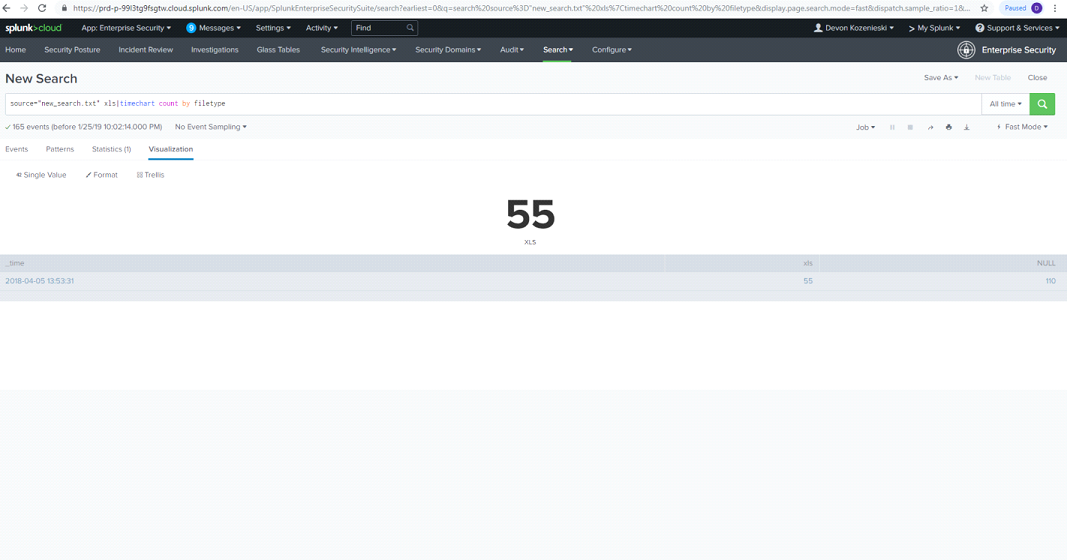
Open the “Search” menu and confirm that the source you want was set to the file name (in quotes). Setting the time span for the search to “All Time” will allow you to see all the data (every entry) in the PSV log file.
From that view, you can search the data using Splunk command syntax. For example, you can look for a specific field data values like
source=”DarkShieldlog.psv” filetype=”XLS”
returns only entries containing XLS files. Inserting a term following the source and prior to any commands will search all of the data entries containing that term. For example,
source=”DarkShieldlog.psv” pdf |stats count by “name”
finds log entries that contain the term “pdf”, and returns with the number of people (by name) which DarkShield found (e.g., 5 Fred’s, 6 Sally’s) in pdf files.
Use the pipe(|) symbol to add even more commands to the search. Some popular commands are |stats, |chart, and |timechart. These can be used with other commands and searches to create specific results, like this one:
Splunk ES can also recommend specific searches (and thus visualizations) to you. To enable that feature, you must first select those fields you want Splunk to consider in the Events tab. Once you’ve done that, those fields are added to ‘interesting fields’ and clicking on any of them will reveal a suggested of search commands pertinent to that field. This also saves time in having to recall and manually enter the same search parameters.
Visualizing the Data
For an example, try the command “|stats count by filetype”. This will display a table with the number by files in each format DarkShield scanned for PII. Selecting “Visualizations” will allow you to choose more graphical forms for displaying data with the stats command. Options include bar and pie charts, dials and gauges, scatter plots, maps, etc. The visualizations can be further customized with different colors, labels, and sizes. The Trellis layout can be used to help visualize multiple data relations.
Once you are satisfied with the visualization, hover your cursor over the “Save As” menu and select “Dashboard Panel” from the menu. The panel can be saved as a new dashboard for the first time, or you can select existing to add new panels to an existing dashboard.
Dashboarding in Splunk ES
You can move these visualizations by dragging them around the screen, and multiple visualizations can be broken into vertical sections within the same row This is done by editing the dashboard in “UI” mode. There is also a “Source” mode if you know how to edit the code.
Now that you have an insightful dashboard to look at, you can make it more accessible in a few different ways. The “Export” option allows the dashboard to be saved to a PDF file. Be aware that Trellis visualizations will not show with this option, however.
You can also set a dashboard as the Home Dashboard by clicking the “…” button and clicking the appropriate selection from the menu.
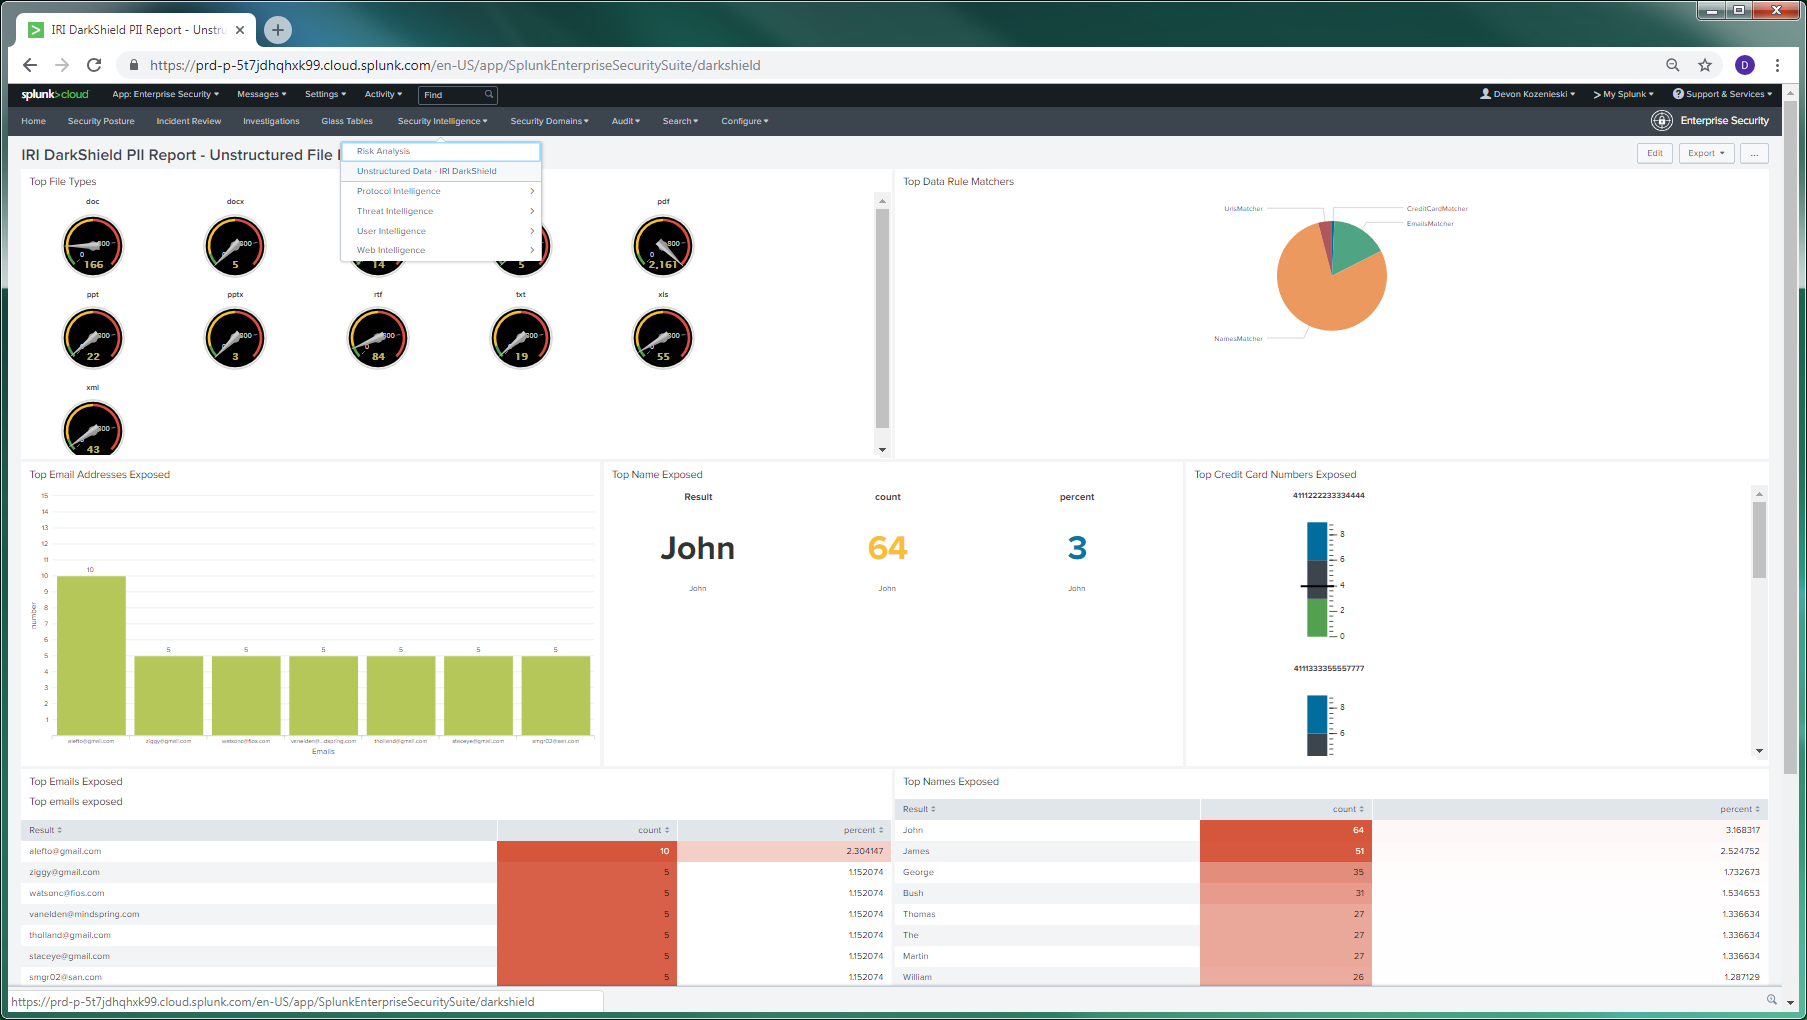
Here is an example of a completed dashboard showing IRI DarkShield log results in various visual forms within Splunk ES:
It is also possible to make DarkShield results more accessible from main menus in Splunk ES through <Configure <General <Navigation options in the top toolbar. On this page, you can modify the navigation interface by adding (or deleting) menus and views.
To add a dashboard as a view, click on the eye button, select “Link” from the View Options, type in a name, and copy and paste the URL link from your dashboard page into the “Link” category.
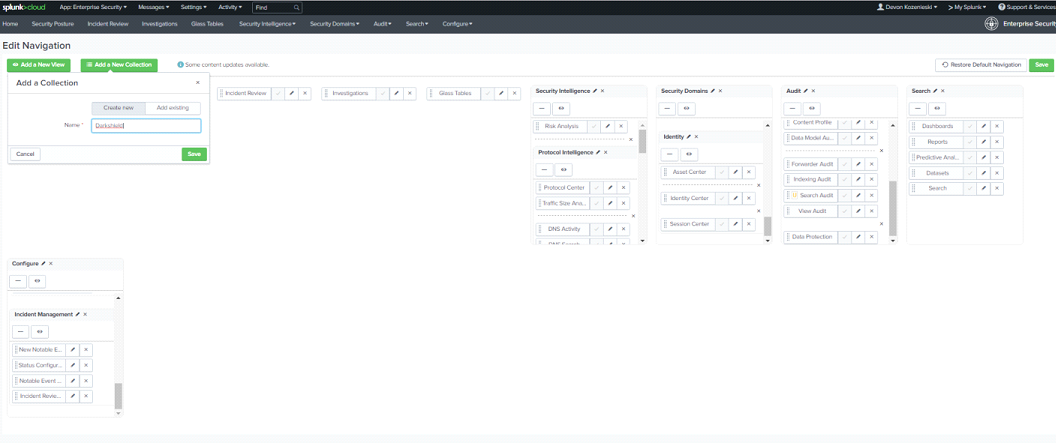
Select save, and confirm how easy it is to navigate to your DarkShield dashboard from the top level menu. And with that, you’re now leveraging IRI DarkShield and Splunk ES to reveal and remediate PII in unstructured files through a now more holistic view of enterprise security holes!
In my next article, I will describe how you can use the information displayed to take action.


2 COMMENTS
[…] unserem Blog hier finden Sie ein Beispiel für Splunk ES, das die DarkShield Dark Data Suche und das Maskieren von […]
[…] unserem Blog hier finden Sie ein Beispiel für Splunk ES, das die DarkShield Dark Data Suche und das Maskieren von […]