Linear Regression – A Predictive Tool in IRI Voracity…
Linear regression is a staple data analysis function for financial, economic, research, and many other disciplines, that helps discover new data correlations. Users of the IRI Voracity platform can now simultaneously process big data from any number of sources and present customized trend lines to help business users make predictions.
Linear regression expands on previously covered analytic or preparatory capabilities in constituent Voracity technology, such as:
- prediction using standard deviation in IRI CoSort
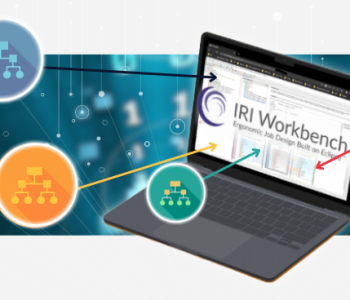
- unstructured data packaging for Splunk in IRI Workbench
- protection of PII for Pentaho in IRI FieldShield
This article (and embedded video) demonstrates how to simultaneously perform regression analysis using the “quick_stats” field function in the CoSort SortCL program, and generate a .pdf report with confidence intervals on x-y value pairs using BIRT in the IRI Workbench GUI (built on Eclipse) and a Boost C++ library function. A planned update or alternative to this article will feature another graphical approach to predictive analytics in IRI Workbench using the Voracity data provider for KNIME along with connected decision tree learning and analytics nodes.
The auto-generated report provides a base set of statistics about the x and y values at the time the entire data set is ingested. Thus ‘big’ source data integration and calculation are running simultaneously with the visualization of those results … and all in the same “pane of glass” controlling both data processing and presentation. With Voracity’s task scheduler, you can run such reports at regular intervals and produce a uniform set of general statistics about the x and y data to analyze over time.
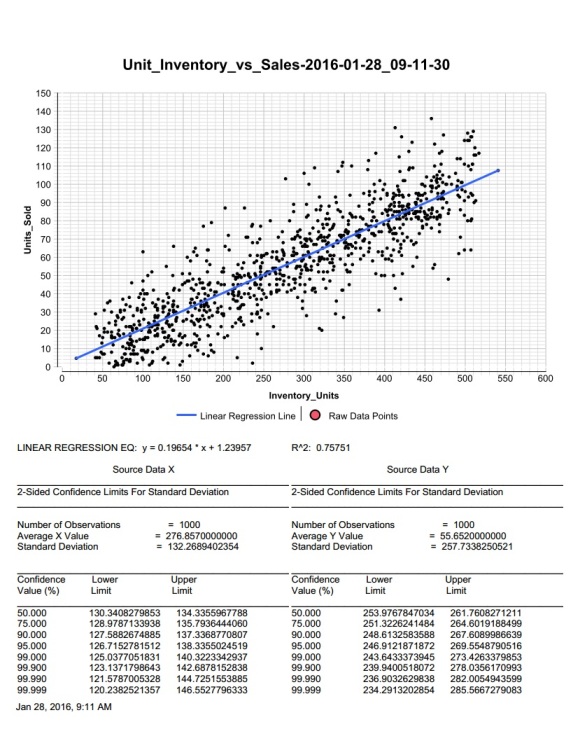
The sample report below contains a graph of the data points, a linear regression analysis line and equation, R-squared value, average x and y values, standard deviations of x and y, and corresponding confidence limits:
Example Report
Use Cases
- You have (x,y) numeric data values that you want to analyze to determine possible correlation for predictive purposes.
- You want a uniform analysis report of (x,y) data produced at a given interval for the purpose of determining change over time.
- Example Linear Regression Use Cases:
Demonstration Script (stats-test.scl)
Demonstration Video
Summary of quick_stats()
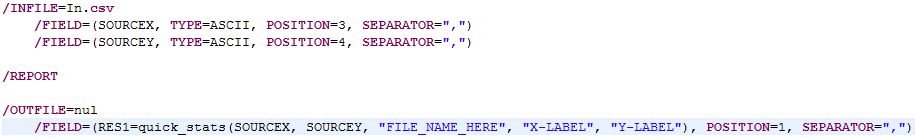
The function quick_stats (SOURCE X , SOURCE Y , FILENAME, X-AXIS LABEL, Y-AXIS LABEL ) takes in five (5) arguments as follows:
- Argument 1 – SOURCE X value (integer or decimal)
- Argument 2 – SOURCE Y value (integer or decimal)
- Argument 3 – FILENAME you want the resulting report to have. This name will have the date and time appended upon creation. (ie. “FILENAME_2016-01-04_11.45.30”)
- Argument 4 – X-AXIS LABEL you want on the graph (ie. “X_AXIS_LABEL”)
- Argument 5 – Y-AXIS LABEL you want on the graph (ie. “Y_AXIS_LABEL”)
The linear regression line and all statistics contained within the report are calculated from the entire data-set. Do to report size limitations, a maximum of 1000 points are displayed on the graph. So, if 1,000,000 x-y value pairs are passed into the function, every one is used in calculations, though a random 1000 are displayed on the graph.
Required Preparation
Because this function is new, there are a few steps you must take to make it work:
- In IRI Workbench, create a new IRI Project named “Repo” from the New toolbar.
- Download the latest BIRT Runtime Release Build from the BIRT download page.
- Unzip the BIRT Runtime Release Build zip file into a temporary location.
- Copy the folder ReportEngine from inside the temporary location into the root of the drive that IRI software is installed on. Creating C:\ReportEngine for a default installation of CoSort.
- Download quick_stats.zip from the IRI Website.
- Unzip quick_states.zip into your CoSort install directory, C:\IRI\CoSort95 by default.
- Copy all the files from the examples\quick_stats_example_files folder unzipped from quick_stats.zip into the Repo project that you created in Step 1.
BIRT Report Designer
To customize the report, you must have the BIRT Report Designer plugin installed in the IRI Workbench (Eclipse) GUI as follows. Refer to this page to use the update manager to install it, version 4.7 or later to be compatible with SimRel versions of Workbench.
If you have any suggestions for a specific type of in-process data analysis you might find useful, please leave a comment below, or email voracity@iri.com.