
Machine Learning in Cancer Prediction: A Voracity-KNIME Use Case
In predictive analytics, machine learning involves training a computer to evaluate data sets and create prediction models from trends it finds in the data. Machine learning builds off traditional statistics and creates larger and more advanced models faster than a person ever could. It can even automate many of these processes so that little supervision is needed.
Machine learning modules for prediction and diagnostics are included in KNIME, a popular open source data science platform built on Eclipse that features many provided and community-contributed data mining and visualization nodes. This article focuses on a KNIME decision tree node that uses machine learning to improve the reliability of breast cancer prediction.
The analytic nodes involved here also leverage a new high performance ‘Job Source’ or ‘Data Provider’ node in the KNIME workflow configured and run in the same Eclipse panel with the IRI Voracity data management platform. The purpose-built Voracity node for KNIME wrangles and PHI-anonymizes high volumes of tumor measurement data, and simultaneously feeds its results in memory to the KNIME analytic nodes connected to it.

In our example, Voracity prepared raw data containing 20 different measurements of breast cancer tumours, including their overall size, shape and features of the cells’ nucleus. Within seconds, the prepared results are flowing into a decision tree prediction to help determine if any given tumour is likely to be malignant or benign.
Here is the workflow:

Once Voracity has prepared the measurement data, a KNIME normalizer node is used to z-score normalize the measurements. This will make all the values from each column fit into a much smaller range of numbers than the original data. This lets the learner create a more accurate prediction by removing impurities and creating a more symmetric distribution. Normalizing data is common in machine learning to create better accuracy and usually doesn’t hurt even if the data doesn’t need it.
The next node partitions the table by 80%. This is done so that one part can be used to create a predictive model and the remaining values are used to test how accurate that model is. The more accurate the model, the more likely the type of data being used is good for this prediction.

The Decision Tree Learner node then goes through different variables and creates multiple binary trees. Each of these trees determines if a given factor is likely to be a cause for a malignant tumor before it tries the next variable.
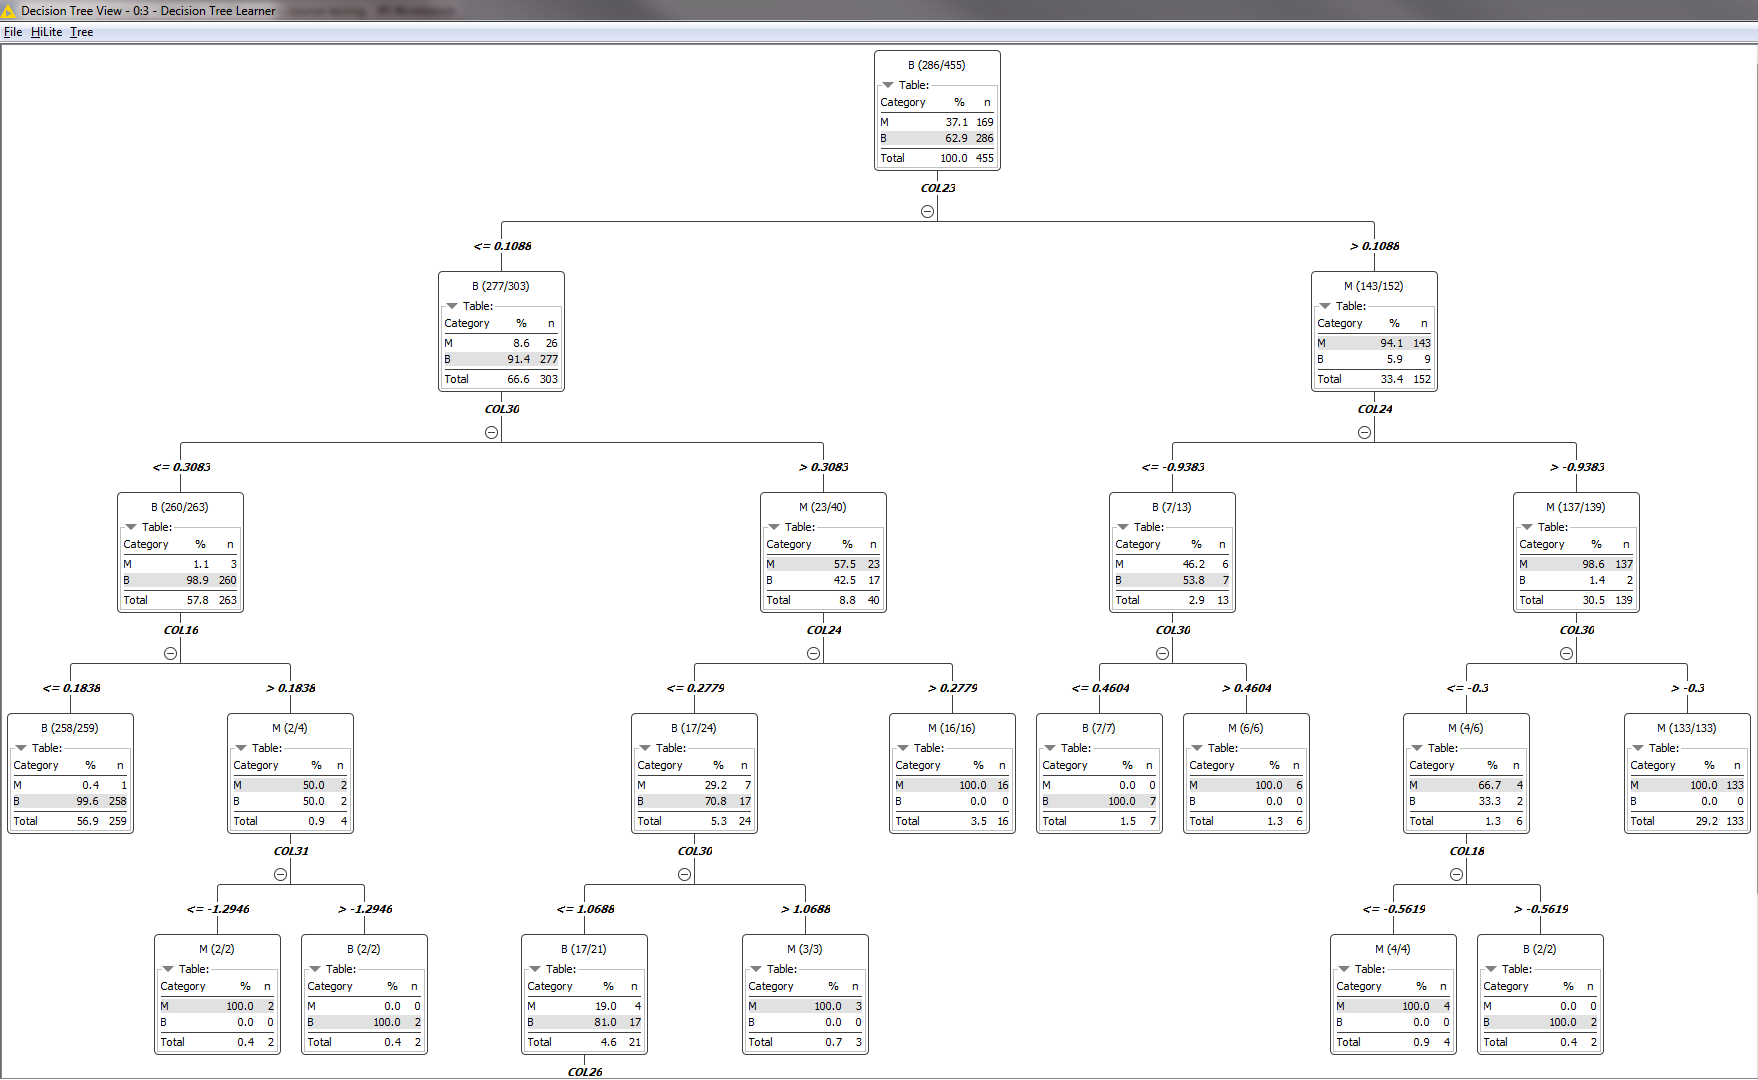
With this information, the predictor and scorer nodes then take that remaining 20% of the partitioned table from earlier. This tests the prediction model for accuracy and strength of the relationships between the results and data.
This is the final result from the Scorer Node.

As you can see, the predictor created a model with an accuracy close to 95% and a Cohen’s kappa of 0.905 based on the given data. This means that there is a very strong connection between these measurements and the likelihood of the tumor becoming malignant.
Decision Trees are just one of many different nodes that KNIME provides. KNIME also provides regression, neural networks, and even 3rd-party deep learning libraries and applications which begin to address applications requiring artificial intelligence.
These include:
- DL4J
- Keras
- ONNX
- Python
- TensorFlow
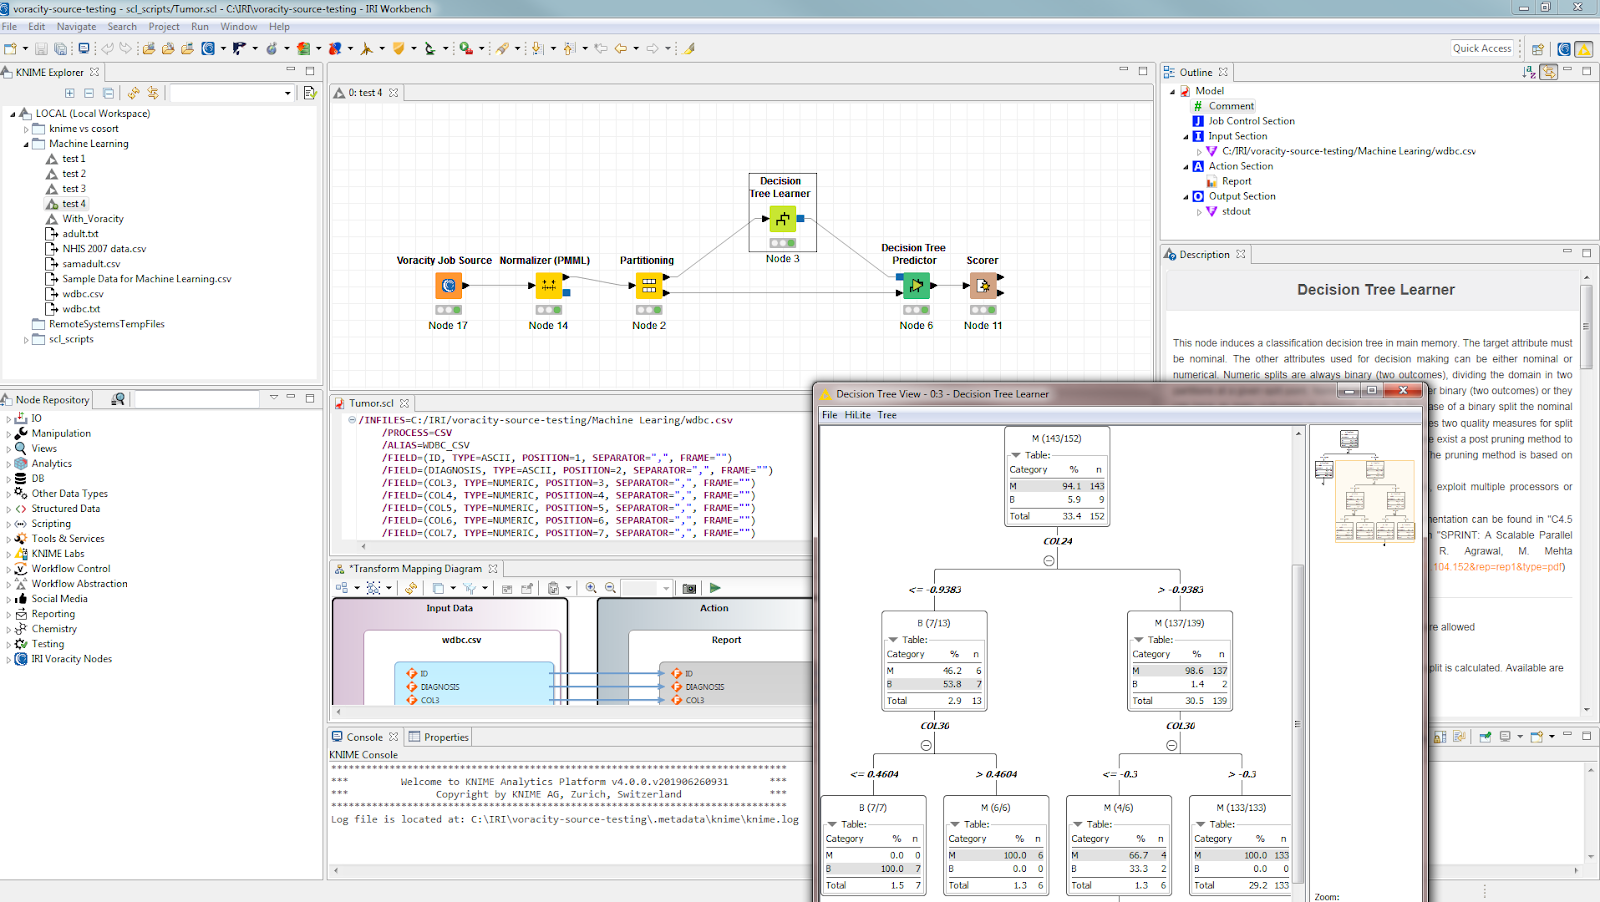
This larger perspective of the project in Eclipse — IRI Workbench to be precise — shows both the KNIME nodes and workflow views, and the IRI Voracity platform tooling and data wrangling job for CoSort that drives the Voracity data source node:
If you have any questions about the use of KNIME or Voracity together in IRI Workbench, contact IRI. If you need help using or building projects in KNIME that leverage data for analytic value, contact the KNIME partners at Redfield Consulting.


2 COMMENTS
[…] out this application of the Voracity node feeding data into KNIME machine learning nodes in the evaluation […]
[…] learn more about KNIME and the Voracity Job Source Node, please visit the KNIME website and our earlier article on point, respectively. If you need help using the two together, or encounter KNIME […]